How do I see ticket insights?
In Tickets, click Insights. Pick what to measure (tickets, points, time to close…) and what to cut it by (status, assignee, label, week…). The Cycle tab also shows the cycle's graph.
Insights answer questions about the team's work: how fast you fix things, who closes the most, what piles up. They read every ticket of the tab you're on, closed ones too, with your filters.
Also called: reports, statistics, dashboard, analytics, burn-up, cycle graph, rapports, statistiques, tableau de bord
Step 1: Open Insights
Open Tickets, pick a tab (Open, Closed, a saved view…) and filter it if you like. Click Insights beside Export.
Click: Tickets › Insights

Step 2: Pick a measure and a slice
Under Insights, pick what to measure: Tickets, Points, Time to close (filed to done), Time in progress (started to done), Time in Triage or Age. Then pick what to cut it by: Status, Assignee, Priority, Type, Label, Project, Customer, Team, Week filed or Week closed. Each bar is one group; for times, the number is the median and the small number how many tickets it counts.
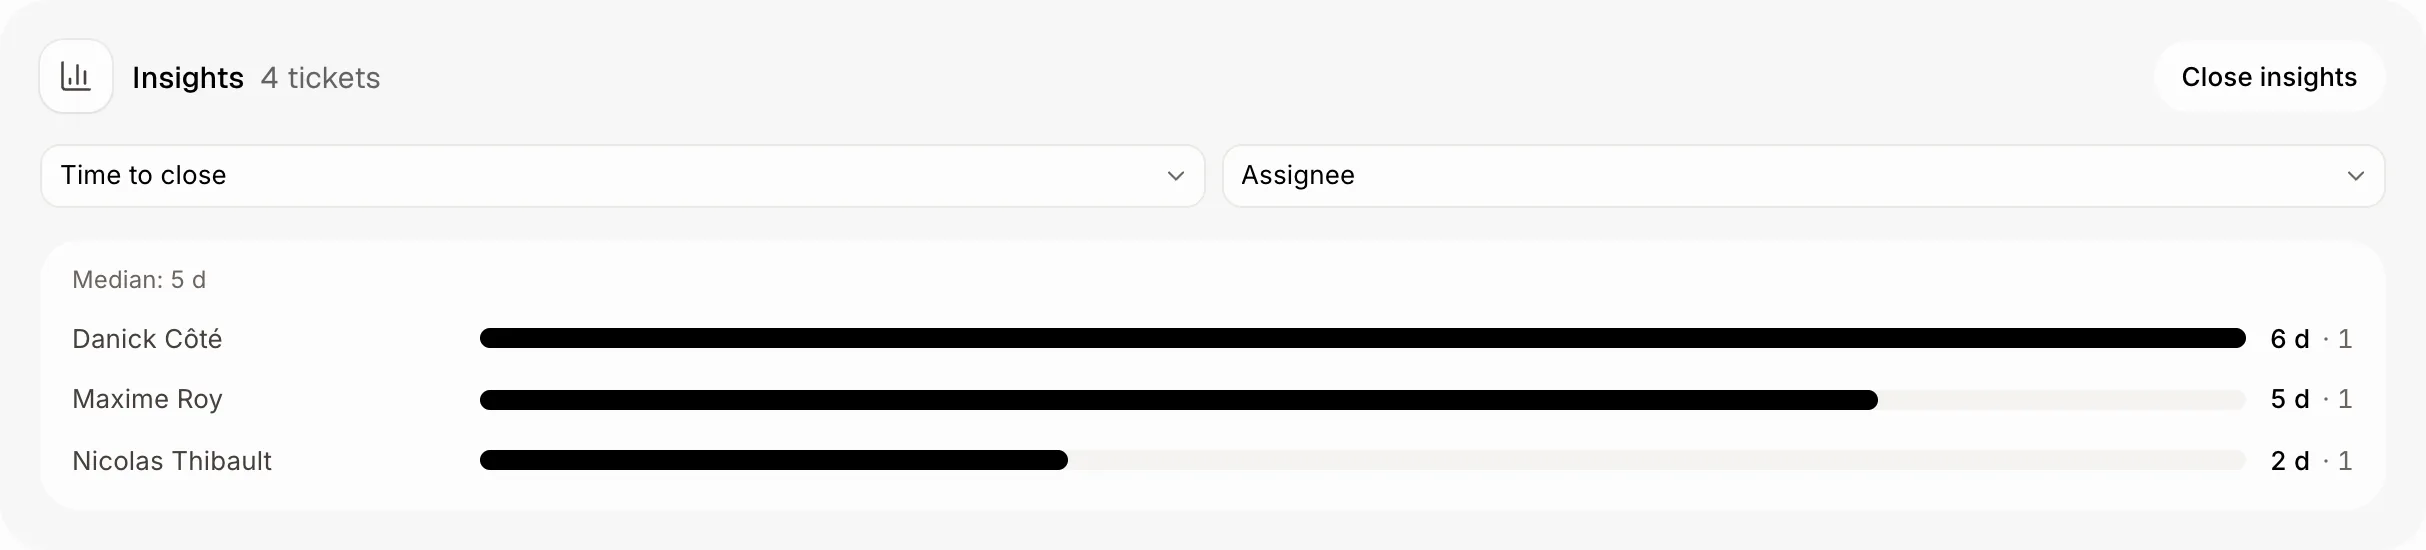
Step 3: Follow the cycle on its graph
On the Cycle tab, the graph under the cycle shows, day by day, the scope (grey), what's started (amber) and what's done (dark), against a dotted target that spreads the work over the working days. The percentage is how much is done, with started work counting for a quarter.
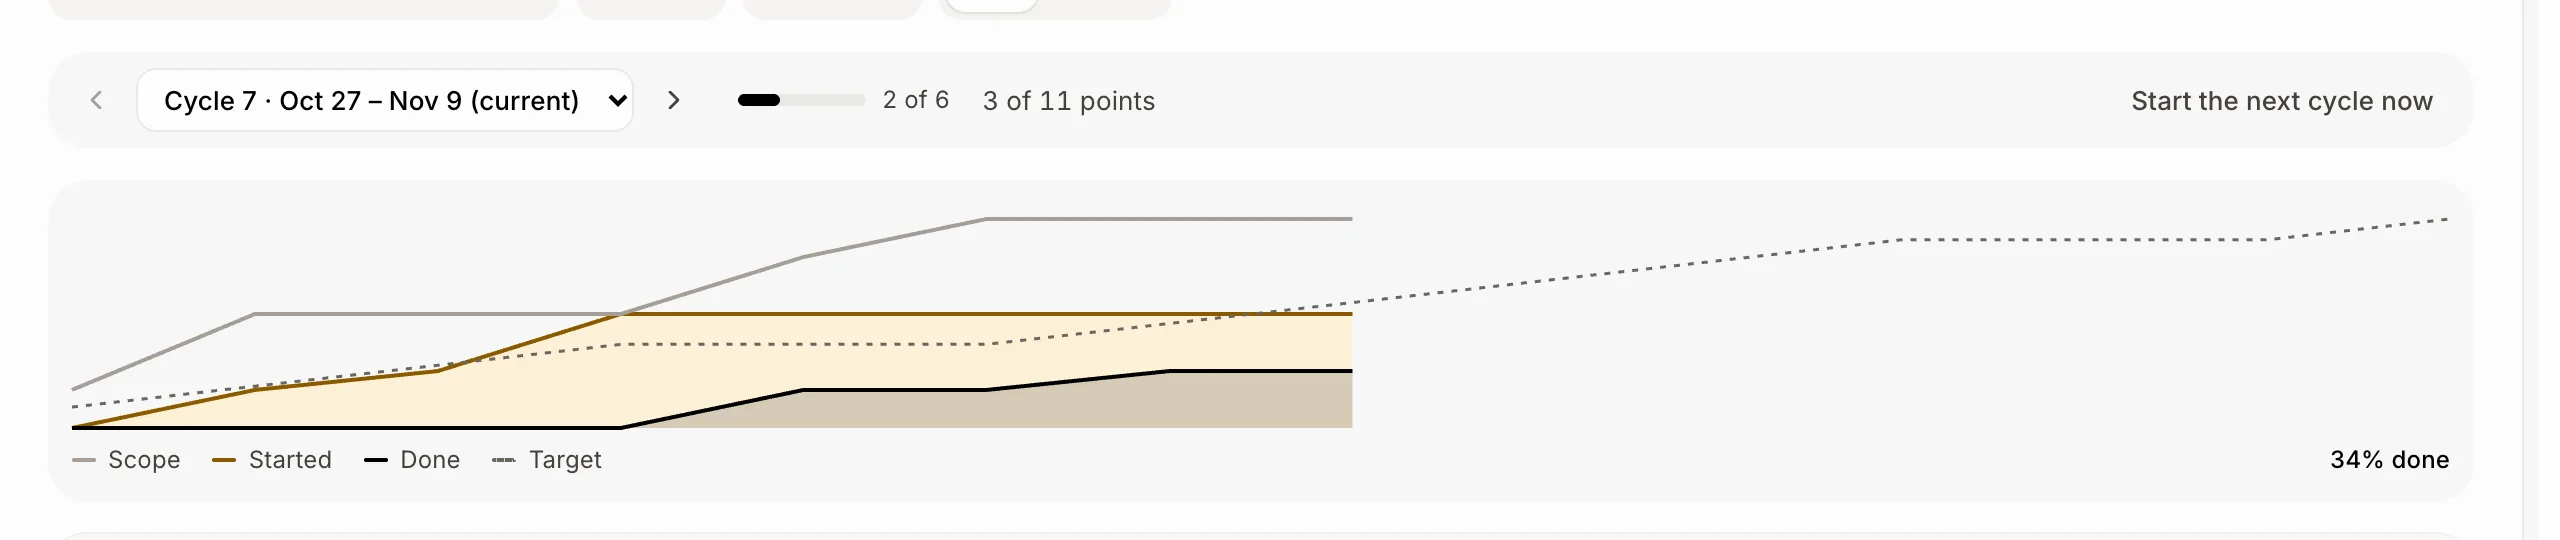
Good to know
Insights read up to 2,000 tickets.
Click Close insights to hide the panel. It stays open in the page's link, so you can share it.
With sizes on, the cycle graph counts points; otherwise tickets. A cancelled ticket leaves the scope.
You can ask Ask Sam: "how long do we take to close tickets, by person?" or "how many tickets did we close each week?".